|
||
| Products Download Events Support Videos | ||

Technical Support
On-Line Manuals
J-Link/J-Trace User's Guide
Enable 4-Pin Trace (ETM)
To enable CoreSight ETM tracing on STMicroelectronics STM32F10xxx devices:
- Connect J-Trace for Cortex to the board's Cortex Debug+ETM connector and to the host computer.
- Enable the Trace Port Interface as described in the STM32F103xx Reference Manual chapter TRACE Pin Assignment.
- Configure µVision to capture ETM trace data.
Enable the Trace Port Interface
-
Create a text file, for example conf_STM32F10xxx.ini,
and enter the following code:
/*-------------------------------------------------------------------
** Define the function to enable the trace port
**-----------------------------------------------------------------*/
FUNC void EnableTPIU(void) {

  _WDWORD(0xE0042004, 0x000000E0);    // Set 4-pin tracing via DBGMCU_CR
}

/*-------------------------------------------------------------------
** Invoke the function at debugger startup
**-----------------------------------------------------------------*/
EnableTPIU();
TRACED[0..3] are output on the pins PE3 through PE6. The trace clock, TRACECK, is configured on pin PE2. By default, these pins are not assigned and need to be configured using the TRACE_IOEN and TRACE_MODE bits of the DBGMCU_CR register.
Use the _WDWORD command to configure the DBGMCU_CR register: _WDWORD(0xE0042004, 0x000000E0);
-
Open the dialog Options for Target — Debug and insert
conf_STM32F10xxx.ini into the Initialization File
field.

Configure µVision to capture ETM trace data
-
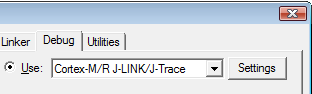
Enable Use, select Cortex-M/R J-LINK/J-Trace, and
click Settings to open the Target Driver
Setup dialog.
-
Click the Trace tab.

- Set Enable and ETM Trace Enable.
- Set Trace Port to Sync Trace Port with 4-bit Data.
- The Core Clock must correspond to the device configuration.
Start the debugging session and verify the captured trace data with a µVision window.
Note
- Always synchronize the settings in the *.ini file with the settings in the Target Driver Setup - Trace Port dialog.
- ETM tracing works in Serial Wire Debug as well as in JTAG Debug mode.
- Use the examples delivered with the Keil board MCBSTM32E as a reference.
ProductsDevelopment Tools |
Hardware & Collateral |
Downloads |
Support |
Contact |