|
||
| Products Download Events Support Videos | ||

Technical Support
On-Line Manuals
µVision User's Guide
Hello: Your first Embedded Program
The HELLO sample program, located in the folder ..\Examples\Hello, can be used to confirm the correct installation of the toolchain. The program prints the text "Hello World" to a serial port. Use this small application to start compiling, linking, and debugging an application with µVision. The example program operates on various devices. The only on-chip peripheral used is the serial port (along with a baudrate generator). A target CPU is not needed. µVision simulates the hardware required for this program.
HELLO Project File
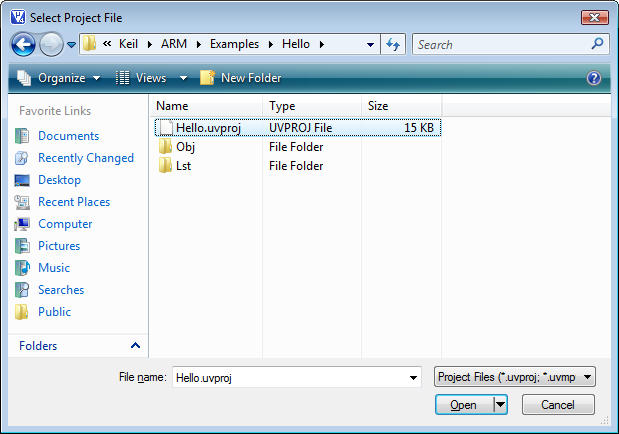
µVision maintains applications in a project file. Load this project using the menu Project - Open Project and open HELLO.UVPROJ from the folder …\ARM\EXAMPLES\HELLO. Projects have the extension .UVPROJ. Older versions have the extension .UV2. Both file types can be opened with µVision. The extension UV2 is converted automatically to UVPROJ.
Editing and Building HELLO.C
Double-click on HELLO.C in the window Project. µVision loads and shows the content of the file in the editor.
![]() Compile and link your application using the
button Build or the menu Project - Rebuild all target
files. µVision starts translating and linking the source files
and creates an absolute object module that can be loaded into the
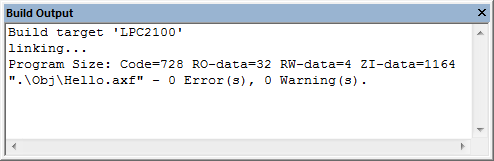
µVision Debugger for testing. The status of the build process is
shown in the window Build Output. You should encounter no
errors when building sample projects.
Compile and link your application using the
button Build or the menu Project - Rebuild all target
files. µVision starts translating and linking the source files
and creates an absolute object module that can be loaded into the
µVision Debugger for testing. The status of the build process is
shown in the window Build Output. You should encounter no
errors when building sample projects.
Testing and Debugging HELLO.C
![]() Once the program is compiled and linked, start
testing it with the µVision Debugger. Use the toolbar button or the
menu Debug - Start/Stop Debug Session. µVision initializes the
debugger and starts executing the program until the function
main is reached. By default, a breakpoint has been set to stop
execution there.
Once the program is compiled and linked, start
testing it with the µVision Debugger. Use the toolbar button or the
menu Debug - Start/Stop Debug Session. µVision initializes the
debugger and starts executing the program until the function
main is reached. By default, a breakpoint has been set to stop
execution there.
![]() Open the Serial window that
displays the serial output. Use the toolbar button or the menu
View - Serial Windows.
Open the Serial window that
displays the serial output. Use the toolbar button or the menu
View - Serial Windows.
![]() Run the application using the toolbar button
or the menu Debug - Run. The program continues executing and
displays the text "Hello World" in the serial window. After
HELLO outputs "Hello World," it begins executing an endless
loop.
Run the application using the toolbar button
or the menu Debug - Run. The program continues executing and
displays the text "Hello World" in the serial window. After
HELLO outputs "Hello World," it begins executing an endless
loop.
![]() Halt program execution with the toolbar
button or the menu Debug - Stop. You may also press ESC
in the window Command.
Halt program execution with the toolbar
button or the menu Debug - Stop. You may also press ESC
in the window Command.
Single-Stepping and Breakpoints
![]() Use the toolbar button or the menu Debug
- Insert/Remove Breakpoint to maintain breakpoints. Breakpoints
can be set or removed also in the editor by clicking into the left
gray margin, or by using the context menu.
Use the toolbar button or the menu Debug
- Insert/Remove Breakpoint to maintain breakpoints. Breakpoints
can be set or removed also in the editor by clicking into the left
gray margin, or by using the context menu.
![]() Reset the CPU using the toolbar button or the menu
Debug - Reset CPU. If you have halted HELLO start program
execution with Run. µVision will stop the program at the next
breakpoint.
Reset the CPU using the toolbar button or the menu
Debug - Reset CPU. If you have halted HELLO start program
execution with Run. µVision will stop the program at the next
breakpoint.
![]() Use single-stepping commands from the toolbar or
the menu Debug. The instruction that is executed next is
marked with an yellow arrow. The arrow moves with each stepping
command.
Use single-stepping commands from the toolbar or
the menu Debug. The instruction that is executed next is
marked with an yellow arrow. The arrow moves with each stepping
command.
![]() Place the mouse cursor over a variable to
view its value.
Place the mouse cursor over a variable to
view its value.
![]() Stop debugging at any time with the Start/Stop
Debug Session command.
Stop debugging at any time with the Start/Stop
Debug Session command.
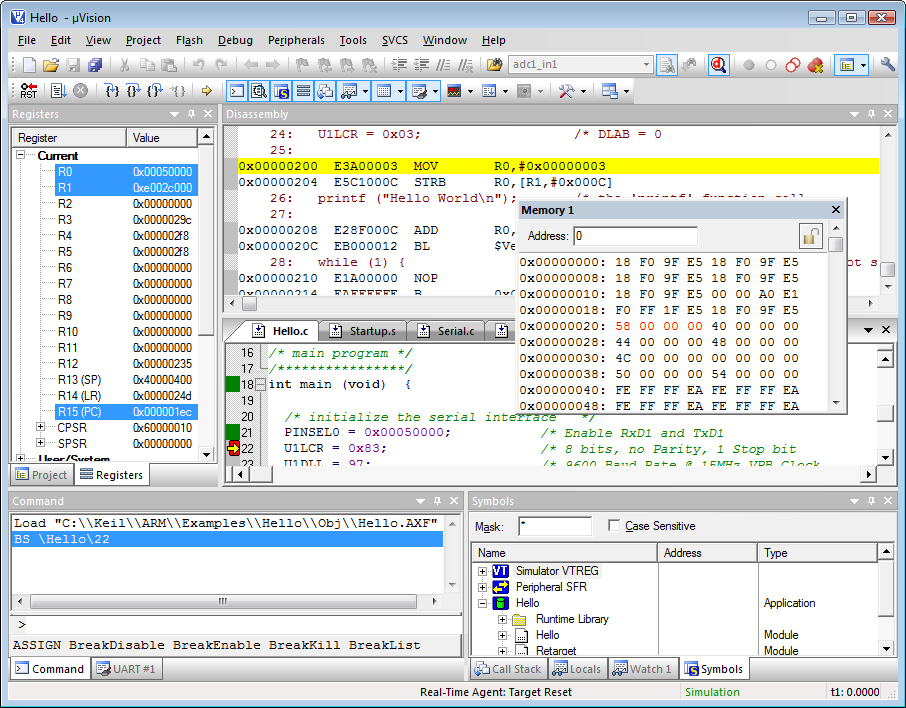
The following picture shows a possible screen layout:
ProductsDevelopment Tools |
Hardware & Collateral |
Downloads |
Support |
Contact |